如何利用百度echarts做一个3d柱状图(ets效果),下面web建站小编给大家详细介绍一下实现代码!
实现代码如下:
const myEcharts = echarts.init(document.getElementById('chart'));
var xData = ["2020", "2021"];
let colorData = [
  ['#87C53E', '#97D44F'],
  ['#40CDB9', '#2EAE9C'],
  ['#2CB8E6', '#0096C7'],
  ['#2C8CE6', '#1949BF'],
  ['#1949BF', '#2C61E6'],
  ['#341EA9', '#4829E4'],
  ['#6942B0', '#9162DE'],
  ['#9B40CA', '#BE5CDE'],
  ['#E18439', '#FFA127'],
  ['#DF9A37', '#FFC946'],
  ['#D2CB04', '#FFF95A'],
  ['#9FE04B', '#CAFF86']
]
let obj = {
  '1月': [10, 11],
  '2月': [12, 13],
  '3月': [8, 10],
  '4月': [9, 14],
  '5月': [10, 17],
  '6月': [9, 13],
  '7月': [5, 12],
  '8月': [5, 12],
  '9月': [5, 12],
  '10月': [5, 12],
  '11月': [5, 12],
  '12月': [5, 12],
}
let testData = [];
let seriesArr = [];
for (let item in obj) {
  testData.push(item)
  seriesArr.push(obj[item])
}
let lastYear=0;
let thisYear=0;
seriesArr.map((i)=>{
lastYear += parseInt(i[0]);
thisYear += parseInt(i[1]);
})
let sumValue = [lastYear,thisYear];
let option = {
  backgroundColor: "#1a2439", //背景色
  tooltip: {
show: false,
  },
  textStyle: {
color: "#C9C9C9",
  },
  color: ["#74AF2E", "#74AF2E", "#2EAE9C", "#0096C7", "#0279CD", "#1949BF", "#1949BF", '#6942B0', '#9B40CA',
'#E18439', '#DF9A37', '#D2CB04', '#9FE04B', '#9FE04B'
  ],
  legend: {
type: "scroll",
orient: 'vertical',
selectedMode: false, //图例点击失效
right: "10%",
top: "15%",
textStyle: {
  color: "#ffffff",
  fontSize: 14,
},
  },
  grid: {
containLabel: true,
left: "10%",
top: "20%",
bottom: "10%",
right: "30%",
  },
  xAxis: {
type: "category",
data: xData,
axisLine: {
  show: false,
  lineStyle: {
color: "#B5B5B5",
  },
},
axisTick: {
  show: false,
},
axisLabel: {
  margin: 20, //刻度标签与轴线之间的距离。
  textStyle: {
fontFamily: "Microsoft YaHei",
color: "#18BBFF",
  },
  fontSize: 16,
  fontStyle: "bold"
},
  },
  yAxis: {
type: "value",
axisLine: {
  show: false,
  lineStyle: {
color: "#B5B5B5",
  },
},
splitLine: {
  show: true,
  lineStyle: {
color: '#466ABA'
  }

},
axisLabel: {
  textStyle: {
fontFamily: "Microsoft YaHei",
color: "#18BBFF",
  },
  fontSize: 16,
},
  },
  series: seriesData(seriesArr)
};
console.log(option)
myEcharts.setOption(option);

function seriesData(data) {
  let barData = [];
  let pictorialBarData = [];
  let countArr = [];
  let count = 0;
  let count_1 = 0;
  let testObj = [];
  data.map((item, index) => {
barData.push({
  "name": testData[index],
  "type": "bar",
  data: item,
  stack: "zs",
  type: "bar",
  barMaxWidth: "auto",
  barWidth: 50,
  itemStyle: {
color: {
  x: 0,
  y: 0,
  x2: 0,
  y2: 1,
  type: "linear",
  global: false,
  colorStops: [{
offset: 0,
color: colorData[index][0],
  },
  {
offset: 1,
color: colorData[index][1],
  },
  ],
},
  },
  label: {
show: true,
offset: [55, 0]
  },
  labelLine: {
show: true,
  }
});
countArr = [];
count += item[0];
count_1 += item[1];
countArr.push(count, count_1);
pictorialBarData.push({
  data: countArr,
  type: "pictorialBar",
  barMaxWidth: "20",
  symbolPosition: "end",
  symbol: "diamond",
  symbolOffset: [0, "-50%"],
  symbolSize: [50, 20],
  zlevel: 2,
})
  })
  let btArr = [{
data: [1, 1],
type: "pictorialBar",
barMaxWidth: "20",
symbol: "diamond",
symbolOffset: [0, "50%"],
symbolSize: [50, 20],
zlevel: 2,
  }, {
data: data[0],
type: "pictorialBar",
barMaxWidth: "20",
symbol: "diamond",
symbolOffset: [0, "50%"],
symbolSize: [50, 20],
zlevel: 2,
  }];
  barData.unshift(
{
  name: '总数',
  type: 'bar',
  barGap: '-100%', // 左移100%,stack不再与上面两个在一列
  label: {
normal: {
  show: true,
  color:'#fff',
  position: ['18',-25],   //  位置设为top
  formatter: '{c}',
  textStyle: { color: '#fff' }
}
  },
  barWidth: 50,
  itemStyle: {
normal: {
  color: 'rgba(128, 128, 128, 0.3)'// 仍为透明
}
  },
  data: sumValue,
})
  let arr = [...barData, ...btArr, ...pictorialBarData];
  console.log('arr', arr)
  return arr;
}
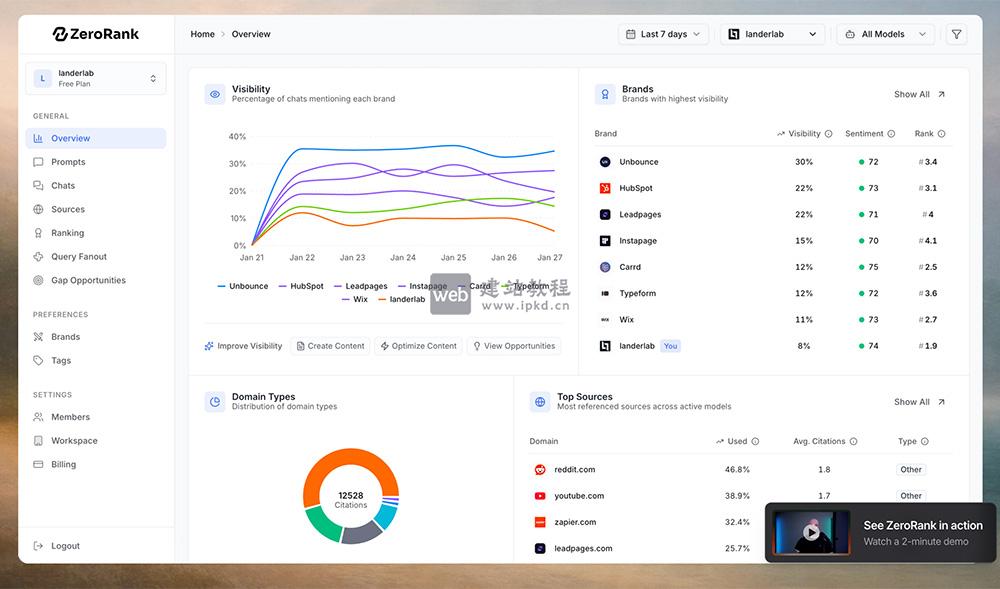
效果图如右上角缩略图
百度echarts雷达图radar根据分数点显示每个不同颜色
百度echarts柱状图/折线图x轴显示全部文本(太长自动换行)
上面是“百度echarts做一个3d柱状图(ets效果)”的全面内容,想了解更多关于 js 内容,请继续关注web建站教程。
当前网址:https://ipkd.cn/webs_2799.html
猜你喜欢
声明:本站提供的所有资源部分来自互联网,如果有侵犯您的版权或其他权益,请发送到邮箱:admin@ipkd.cn,我们会在看到邮件的第一时间内为您处理!

 php语法中Composer自动加载语法